The game vanished. Not crashed with a message — vanished: the window closed, the log stopped mid-sentence, and there was nothing else to look at.
wWinMain had no try/catch, no unhandled-exception filter and no dump writer. The thread manager's worker loop did have a catch, and what it kept was a single std::string that the next failure overwrote and nothing ever logged.
The part that took longest to notice is that the catch falls through. A tick that threw still stamped its timings, still incremented its iteration count, and went back to sleep on schedule. A worker failing on every single tick was statistically indistinguishable from a healthy one — same cadence, same duration, same counters — with one overwritten string as the only evidence, and that string only visible if you happened to have the right console panel open at the right moment.
So this is the machinery that replaces the silence. The last two sections are the harness suite that checks it, and the thing that turned up when I gave an existing harness the ability to fail.
What a catch cannot see
The first decision was scope, and it is the one that mattered most.
An access violation is not a C++ exception. Nor is a divide-by-zero, or a stack overflow. No catch (...) anywhere in the program will ever see one, and they are the majority of what actually kills a game. Scoping this to thrown exceptions would have produced a system that handled the failures I could already survive and missed the ones that were killing me.
Four sources, then: a C++ throw at a managed boundary, an SEH fault through SetUnhandledExceptionFilter, an assertion routed to report before it aborts, and a stall — which throws nothing at all and is only visible by watching a heartbeat.
The assertion case is smaller than the others and worth calling out anyway. DN_ASSERT ends in abort(), which in a debug build raises a CRT dialog: the process looks alive, it is wedged, and anything you deferred until after the abort never runs. Reporting has to happen before it, not after.
The stack has already unwound
Getting a useful stack for a C++ throw is the one genuinely hard problem here, and I had it wrong in my first design note.
At a catch site the stack has already unwound. The frames between the throw and the handler are gone. Capture there and you get a faithful description of where the exception was caught, which you knew, because you wrote the catch.
The fix is to look earlier. A vectored exception handler installed first in the chain runs on the throwing thread at the moment of the throw, before any unwinding. It filters for MSVC's C++ exception code — 0xE06D7363, the msc magic in the high bytes — takes one stack capture into a thread_local, and returns EXCEPTION_CONTINUE_SEARCH. It is an observer; returning anything else would swallow every throw in the engine.
Catch sites then read that back instead of capturing their own. A deliberately-thrown console command now records:
Game_DevCommands.cpp:275   <- the throw itself
DevConsole::Execute
DevConsole::Update
Game::Update
wWinMain (Main.cpp:131)    <- where it was caught
An SEH fault is the mirror image of the same problem. Nothing unwinds, but the interesting stack is not the handler's either — it is in the CONTEXT_RECORD the filter is handed. That needs StackWalk64 over a copy of the context, because the walk mutates what it walks and the dump writer still needs the original intact. A deliberate null write now names the faulting line rather than the filter.
Writing a record on a process you no longer trust
Everything above has to be recorded somewhere, and the constraints on that somewhere are unusual: it is written from arbitrary threads, read while being written, and reached on a path where the process may already be damaged.
No heap. A report written after heap corruption is a second crash on top of the first. Messages copy into fixed storage, stacks into a fixed array, paths are snapshotted into char buffers at install time so the crash path never calls anything that builds a std::string.
No lock. This one is not about speed. A mutex here would be taken on the failure path — including by Kill, moments before it force-terminates a thread that might be holding it. A leaked diagnostic lock silences the record exactly when it matters.
The sequence number is the absolute claim index, not a flag. A reader knows slot i holds event n only if seq == n + 1, and re-checks after copying so a slot recycled mid-copy is discarded rather than returned half-torn. Absolute indices are also what make that check immune to ABA: a full lap of a 16-deep ring lands on n + 17, never back on n + 1.
The registry owns the storage and a thread holds only a slot index — the same inversion the profiler makes, for the same reason. TerminateThread runs no destructors and releases the thread's TLS underneath whoever is holding it, so a table of pointers into TLS would be left with a dangler that the next read follows. In diagnostic code. On the path you reach for when something is already wrong.
One deliberate inversion of the profiler's behaviour: a reboot does not clear the record. The profiler resets a rebooted worker's slot so a predecessor's timings cannot bleed into it. Here the predecessor's events are the entire point — "it threw twice, stalled, and was restarted" is the sentence you are trying to read.
Ordering on the crash path follows from the same reasoning:
The failure that throws nothing
A thread that crashes leaves an event. A thread that stalls leaves nothing: it is still running, it has thrown nothing, it is simply not finishing. There is no record to consult because nothing has happened yet — that is the whole problem.
The only way to find out what it is doing is to go and look: suspend it, walk its stack, resume it.
The obvious implementation deadlocks.
So the walk uses RtlLookupFunctionEntry and RtlVirtualUnwind, which read the PE unwind tables directly and need no library state at all. Nothing between suspend and resume touches DbgHelp, allocates, or logs; symbolizing happens afterwards, once the thread is running again. Where a frame has no unwind entry the walk stops rather than guessing a return address off the stack pointer, because invented frames look exactly as real as true ones.
Against a deliberately wedged worker:
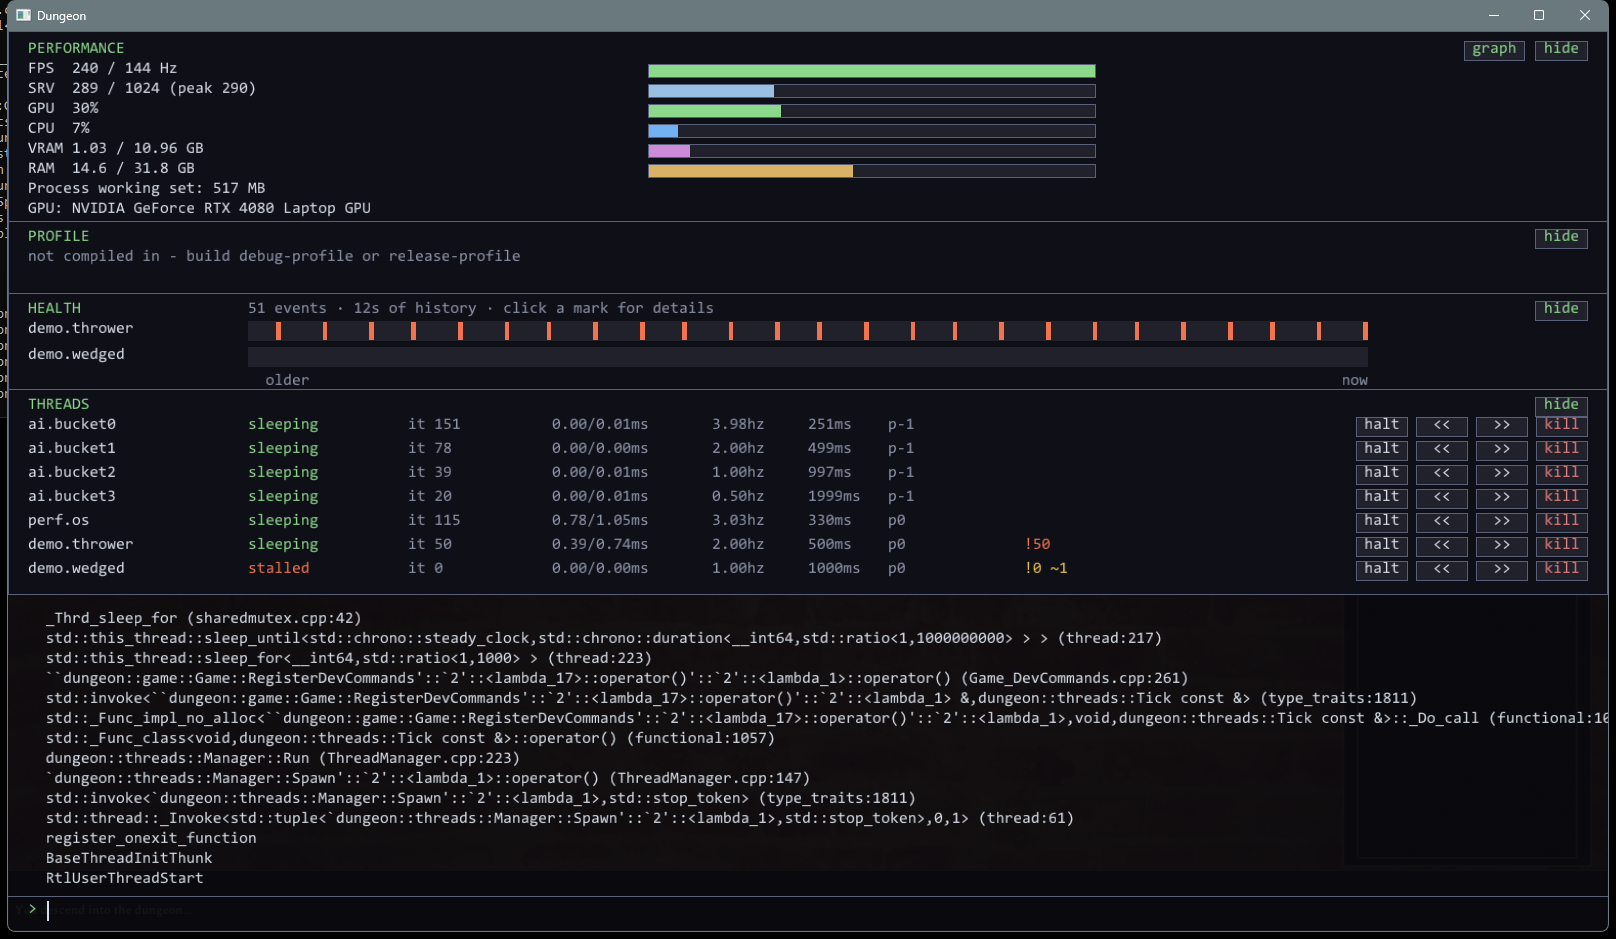
and, for contrast, a healthy AI bucket in its cadence wait — [sleeping], beat 92 ms, condition_variable_any::wait_for at ThreadManager.cpp:250.
Note that the probe prints every frame, unlike a crash report. For a wedged thread the OS frame is the diagnosis: NtWaitForSingleObject names a lock it is blocked on, NtDelayExecution a sleep it is sitting in. The plumbing filter that makes a crash stack readable would here throw away the answer.
Throttling a log without lying to it
I built the repeat-collapse the plan called for — identical consecutive events counted and logged at powers of ten — and the first concurrency test wrote a 1.2 MB log from 16,000 events.
The collapse is blind to a message carrying a tick number. Every one of those messages was distinct, so nothing collapsed. And that is the same failure the system exists to prevent, wearing a different hat: the crash worth finding, buried under a thousand lines of the bug that arrived first, in the file the whole design points at as the place to look.
So there are two layers. Identical repeats collapse to powers of ten; distinct events are rate-limited per thread at eight lines a second, with a line saying how many were swallowed. The record still takes every event — only the log is throttled. The same run afterwards: 2.7 KB.
The generalisable half is which key to throttle on. Not the message, because the message is precisely the part a failing worker varies.
Reading it back
The log is the durable surface, but it is the wrong shape for one question: has this thread been well? A worker that throws and recovers reads perfectly normal a second later — same state, same timings, same tick count — so "is it healthy now" and "has it been healthy" are different questions and only one of them has an answer in a live panel.
So the record gets a strip. One row per thread that has failed, on the same twelve-second axis the profiler graphs use, marks coloured by kind, oldest at the left.
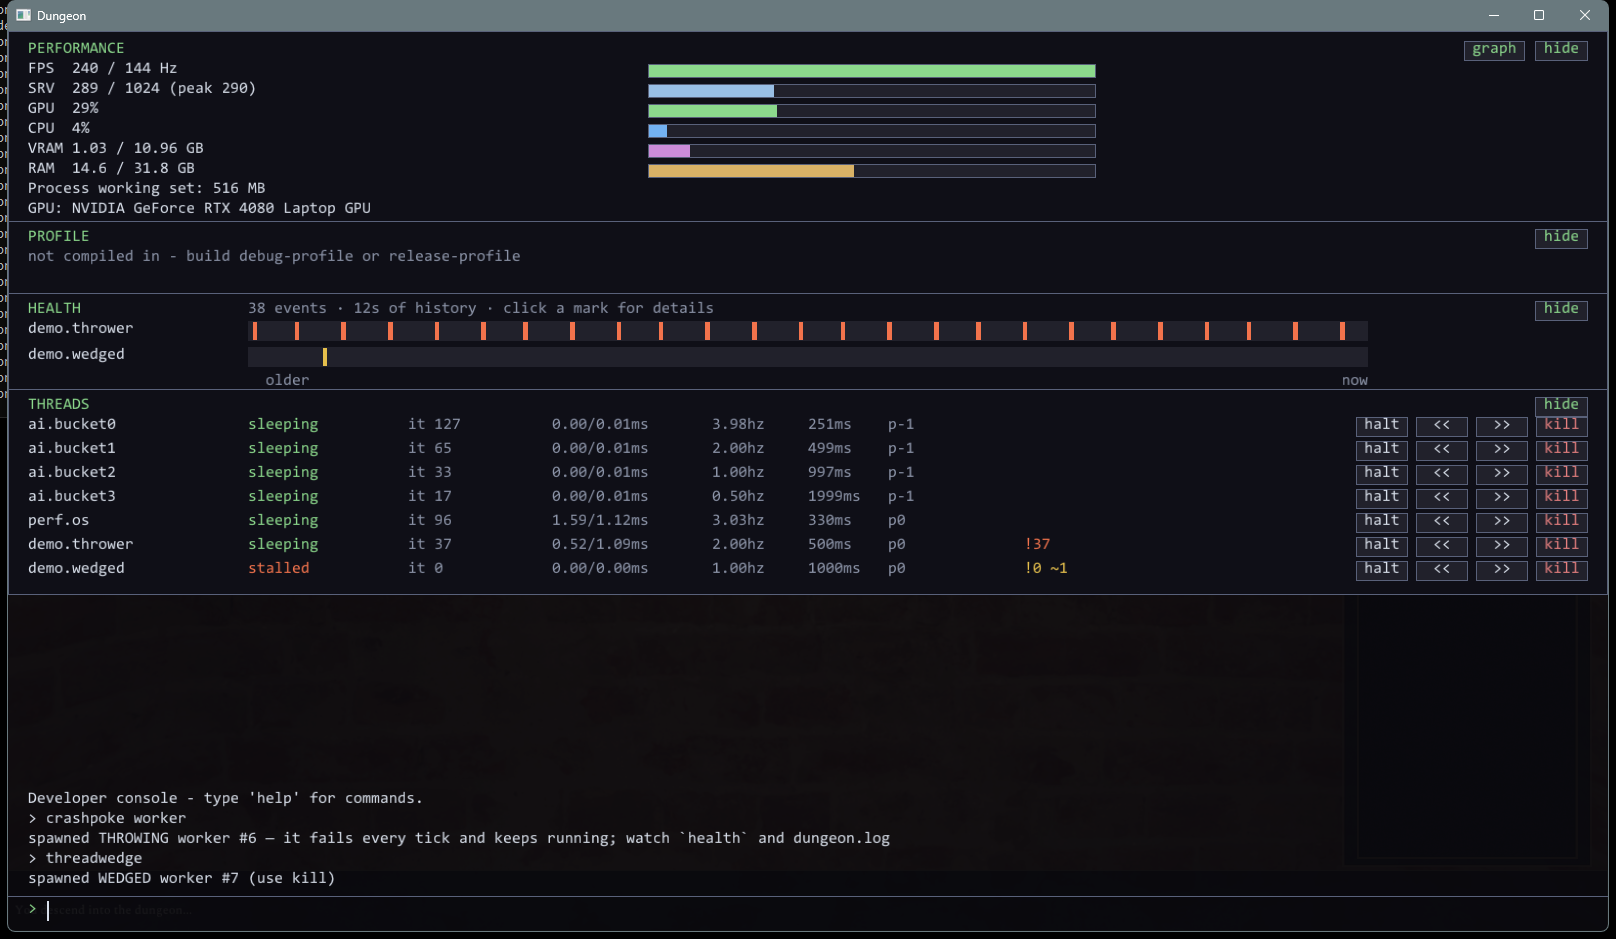
The thread panel's health column is the part I would not have predicted mattering. demo.thrower there reads sleeping · it 37 · 0.52/1.09ms · 2.00hz — a completely healthy row by every measure the panel had before. Only !37 says otherwise. Without that column the panel was actively concealing the thing worth knowing, and I had been looking at it for days.
A mark is clickable, and returns the event with its stack:
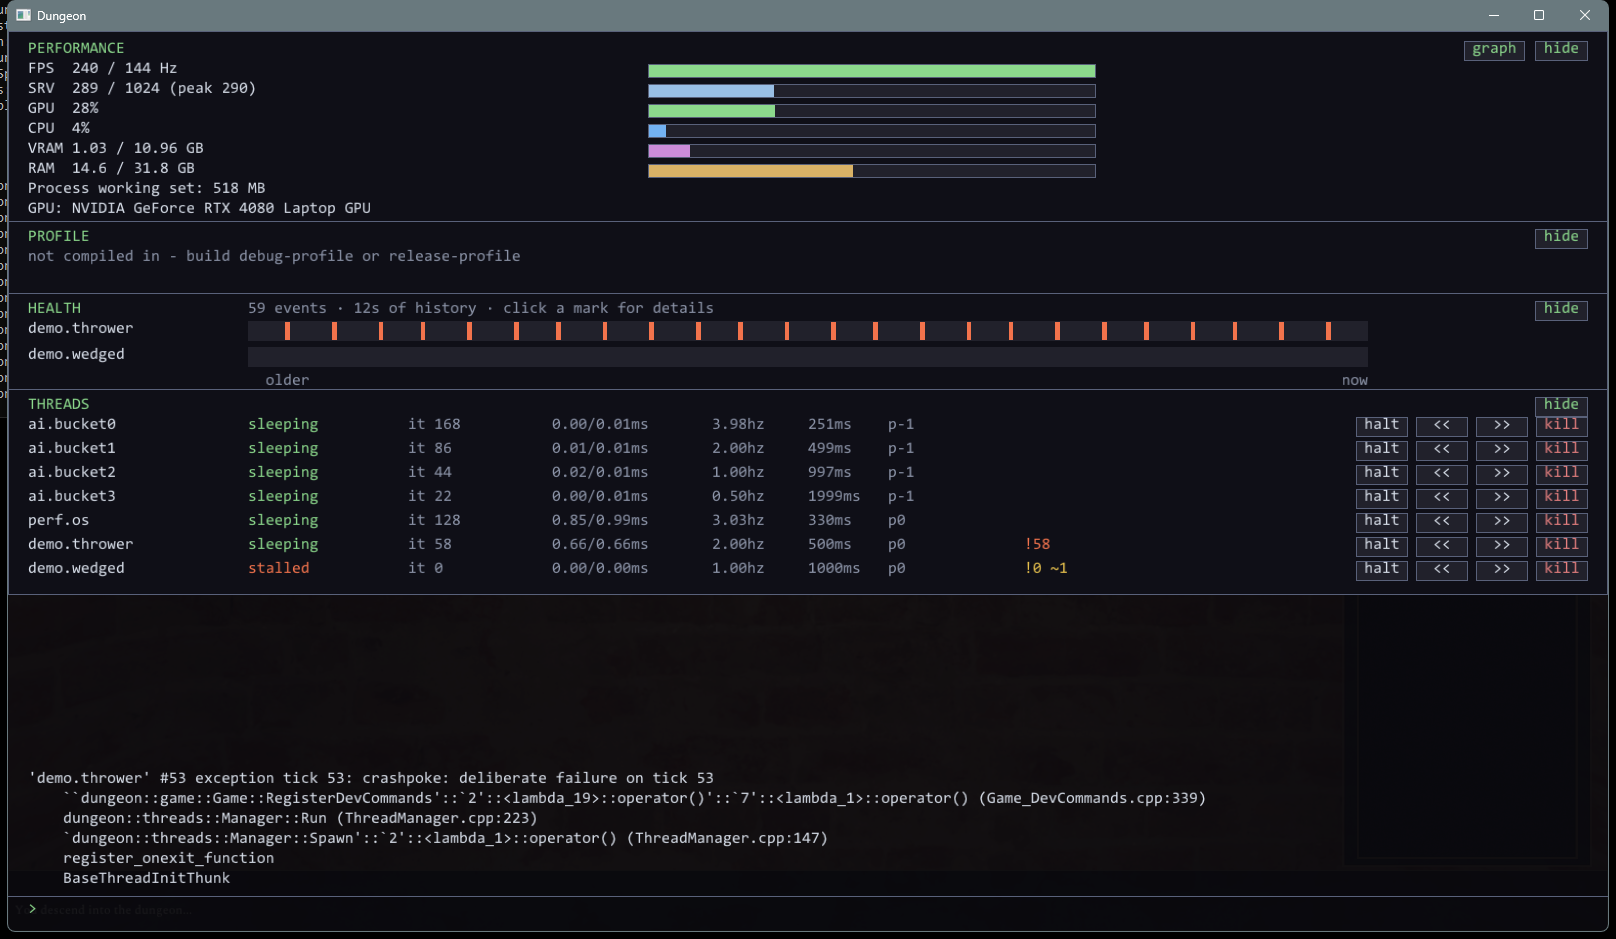
The strip only exists once something has gone wrong. A permanently empty row is one that says nothing 99% of the time and trains you to skip past it on the 1%.
A suite, and a test that can fail
With the diagnostics built, the obvious next question is what stops all of it from quietly rotting. The repo already had four harnesses that produce a machine-readable verdict, and the useful move was less about writing new ones than about making them runnable together and making them honest.
Every check that can be handed a deliberate failure now is, and the suite has a tier that runs all of them that way. Injections are real: the allocation guard is made to allocate every frame, the encoder's packed bytes are corrupted, the diagnostics harness skips every injection so that each expectation goes unmet, and the thread harness plants a worker that ignores its stop token.
A check with no self-test mode is named and skipped, never counted as passing — otherwise the tier claims a coverage it does not have, which is the exact failure it exists to prevent. Five of eight are self-testable; the other three are compile-or-run gates whose failure mode is not silent.
Two audits that already existed and were never automated got scripted. A level check verifies every level file is present and every model a catalog type names is installed — scoped to models deliberately, because a missing texture renders magenta and is survivable while a missing model takes the process down at load. And the UI overlap audit, which the engine has had for a while and which had only ever been run by hand, now sweeps four screens.
The harness that had stopped measuring anything
ThreadStress drives the real thread manager and AI workers under synthetic load through six phases. It evaluated every pass/fail condition it existed for — including the one it is really about, was a worker force-terminated — printed them as prose, and then ended in return 0.
Giving it eleven counted assertions and a real exit code took about twenty minutes. It failed on the first run.
Phase D ramps one worker past its watchdog to prove an overloaded pathfind still stops cooperatively. It was reaching 4488 monsters on a 160×160 full-BFS map at 0.4 ms a tick — a number that is impossible if any of them were pathing, printed in a tidy table that nobody had reason to read closely.
The cause is drift of exactly the kind the suite is for. The harness sets aggroRange = 1e9f with the comment force engage — every monster runs a BFS, and that was true when it was written. The AI has since grown a perception model: archetypes, a sight cone, directional, aware. An unaware directional monster facing yaw 0 must now pass the cone test before it engages, and almost none did. The load phases had become a measurement of an empty world, and the one phase that exists to exercise the force-terminate path had stopped exercising it at all.
One field restores the stated intent. After: 156 monsters, 612 ms peak, crosses the reboot line, supervisor reboots cleanly, plans resume.
Then writing its self-test found a second layer. The per-phase checks read State::Quarantined — but Restart sets that flag via StopOrTerminate and then clears it on the way to relaunching, so a force-terminated worker reads as Running a moment later. In the self-test run the planted worker was force-terminated 26 times and every one of those checks still passed. The durable evidence is the health record, which keeps the Killed event written before the flag was cleared. That check is the one that caught it, and it only exists because of the work in the first half of this entry.
What it cost
I got the log-throttle key wrong, and the failure was the one I was defending against. Collapsing identical messages is the obvious design and it does nothing for a worker that varies its message, which is most of them. 1.2 MB before, 2.7 KB after.
My own UI sweep audited the wrong screen and reported four clean passes. The first version sent Esc and M while the dev console was open, so the console ate the keystrokes and it swept the HUD three times over. It was caught within a minute — but only because the script asserts that each screen's label reached the log, which turned a silent false pass into three loud failures. Without that assertion I would have shipped a sweep that audited one screen and claimed four.
The health timeline had three defects that only a screenshot could find. A thread whose row was created by its first event never showed that event, because the row seeded its baseline from the current counts — which silently swallowed every thread whose first failure was also its only one. The age origin was off by a full lap, so a stall from three seconds ago drew at the twelve-second edge. And a cell is one 240th of the strip, about a pixel, so the first genuine click landed in a gap and reported nothing on a row visibly covered in marks.
A design note I wrote confidently was wrong. I had documented that a throwing tick records no timing because the catch skips ahead. It does not; it falls through. That inverts the claim into a sharper one — a failed tick is statistically identical to a healthy one — but I had written the opposite in a diagram before checking.
fopen_s cannot reopen the process's own log. It opens with _SH_SECURE, which denies write sharing, and the process is already holding the file open for writing. Two tests reported [skip] for a while before I read the sharing mode rather than assuming the file was missing.
What it bought
An access violation that previously ended the process in silence now leaves a named fault with a symbolized stack and a 34 MB dump. A worker that throws every tick is recorded per tick, keeps running, and shows a marker in a panel where every other column reads perfectly normal. A stalled thread can be asked what it is stuck on while it is still stuck, and answers with the line number.
The suite runs its quick tier in 47 seconds and its full tier in about twenty minutes, with one verdict line.
And one existing harness turned out to have been measuring nothing at all, which is the most useful thing anything here found.
How it's proved
The record has its own regression tool: 35 checks against the ring directly, including the one that matters — four writers hammering a single slot while a reader walks it, every event self-describing so a torn read cannot pass. Measured at 16,000 writes against 39,075 live reads, zero torn.
The diagnostics harness breaks the real game seven ways and reads dungeon.log and nothing else. That constraint is the point: if the answer is not in the file you open after a crash, it does not count. Its self-test skips every injection and requires the run to come back FAIL, and all seven cases plus every individual expectation do fail — which is the evidence that none of them is quietly satisfied by an ordinary run.
Lifting the symbolizer out of the allocation tracker was verified by re-running that tracker's own regression: 1921 steady frames, zero violations, unchanged.
Still open
The Killed event kind has no scripted coverage. A hard force-terminate is a button in the thread panel rather than a console command, so a script cannot drive it. The harness prints that on every run rather than leaving the gap to be discovered.
Two screens are not swept. The settings page and the character sheet both need a mouse click to reach, and a scripted click against a layout whose rows move is how a sweep starts silently auditing the wrong screen — which I know because mine did. Named on every run for the same reason.
A fault's frames reach the log and the dump but not the record. Walking the context is the riskiest step on the crash path, so it runs last, after the record is already written. The event carries the fault description and no stack; the stack is two lines below it in the log. That is a deliberate trade and it is still a seam.
ThrowFrames is the last throw, not the throw you are holding. An exception thrown during unwinding overwrites it, so a nested failure can leave an outer catch looking at an inner one's stack. It is rare and visible — the frames will not match the message — and the alternative is keying captures to exception objects, which is machinery the failure path should not have.
Eight log lines per second per thread is a guess. It is not measured against anything; it is the number that made a 16,000-event run readable. A slow, permanent failure at two events a second sails under it entirely and writes 7,200 lines an hour, which may well be right and may well be noise.
A throw between BeginFrame and EndFrame leaves the command list open, so the frame after it is unlikely to be sound. The die-after-ten-consecutive policy bounds how long that can go on rather than fixing it, and I would rather have the bound than a mid-frame recovery path I cannot test.
Three of the eight checks cannot fail on purpose. All three are compile-or-run gates where absence of a self-test is defensible — a broken build produces compiler errors, not a confident green table. That argument is exactly the one I would have made for ThreadStress a week ago.