The frame was 4.1 ms and I could not have told you where a single millisecond of it went. Not vaguely — at all. There was an FPS counter, a CPU percentage, and a lot of reasoning from first principles about which parts of the engine ought to be expensive.
That is a bad position to optimise from, because the thing you are sure about is the thing you never measure. So before touching performance again I built the instrument: a compile-time-gated, per-thread, hierarchical profiler that reports CPU scopes and GPU passes in one tree.
The last three sections are what it found, none of them in a place I would have looked. The third only became visible after I learned that a profiler measuring work still cannot tell you what is holding a frame back — which is the part of this I got wrong first time and had to go back for.
What a scope costs
Every design decision in a profiler falls out of one number: what it costs to ask the clock. Instrument a scope and you pay two timestamps, so that number sets how finely you are allowed to look.
I measured it rather than assuming, on the development machine, pinned to one core, minimum of seven trials:
| call cost | tick | |
|---|---|---|
__rdtsc |
4.52 ns | 0.41 ns |
__rdtscp |
8.49 ns | 0.41 ns |
QueryPerformanceCounter |
9.85 ns | 100 ns |
chrono::steady_clock |
10.80 ns | 100 ns |
A full scope — two timestamps plus the node lookup and accumulate — is 10.6 ns with the TSC against 22.1 ns with QPC. At ten thousand scopes a frame that is 0.11 ms versus 0.22 ms, and honestly both are affordable.
The resolution is what decides it. QPC ticks at exactly 100 ns here, so a scope shorter than a microsecond has both its ends snapped to the grid: a real 250 ns scope reads as 200. Averaging hides that in an aggregate and cannot touch a raw timeline at all. Windows derives QPC from the TSC and then scales it down to 10 MHz; __rdtsc just declines to throw that resolution away.
There is deliberately no per-read fallback to QPC. That would put a branch on the hottest path in the engine to serve a CPU that has not shipped since about 2008. Startup checks for an invariant TSC, warns loudly if it is missing, and carries the answer in the readout so every number below it inherits the doubt visibly.
The gate goes in front of the clock
If the clock is nine of a scope's eleven nanoseconds, then the way to instrument aggressively is to not read the clock.
Every zone carries a compile-time level — a frame landmark, a subsystem phase, an inner loop — and every node in the tree carries a runtime threshold that is inherited by everything beneath it. A scope whose level is past the threshold in force costs a comparison and a balanced push/pop. No timestamp, no node lookup, nothing.
The threshold is raised from the console on one branch at a time:
profile detail frame/render 1
The override lives on the node, not the zone, so it is path-scoped: Physics under Update can be turned up while Physics under the editor preview stays quiet. It inherits downward and costs nothing to inherit, because the effective threshold is already sitting on the shadow stack — one read of a value being carried anyway.
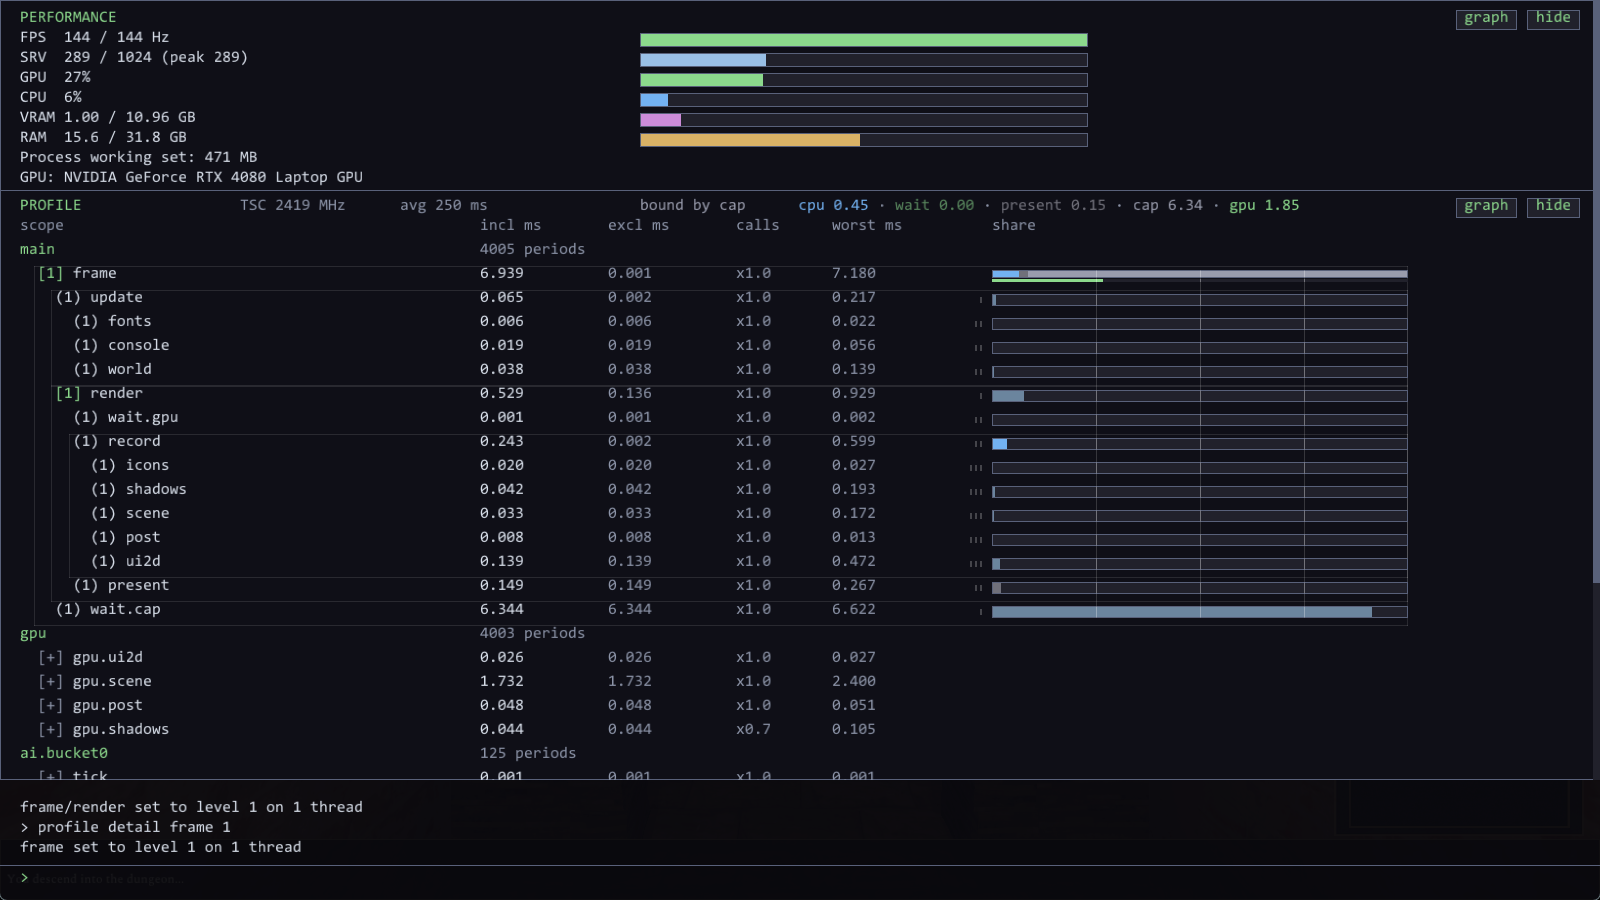
Typing a path is a poor way to reach it, though, because the path is precisely what you are reading the tree to learn. So a row is the control: click it and it cycles inherit → 1 → 2 → back. The marker distinguishes an override set here from a level inherited from a parent — [1] against (1) — since only the first is that row's to clear.
There is a subtlety in that cycle worth naming, because I got it wrong and only caught it by driving the whole loop rather than reading the code. An override governs a node's children, not the node, so the cycle has to count from the level currently in force — otherwise the first click on a row beneath an already-raised parent re-grants a level it was getting anyway and reads as a dead control. And the last step is the mirror of that: testing the effective level alone swallowed the clear, leaving a raised branch with no way back except the typed command.
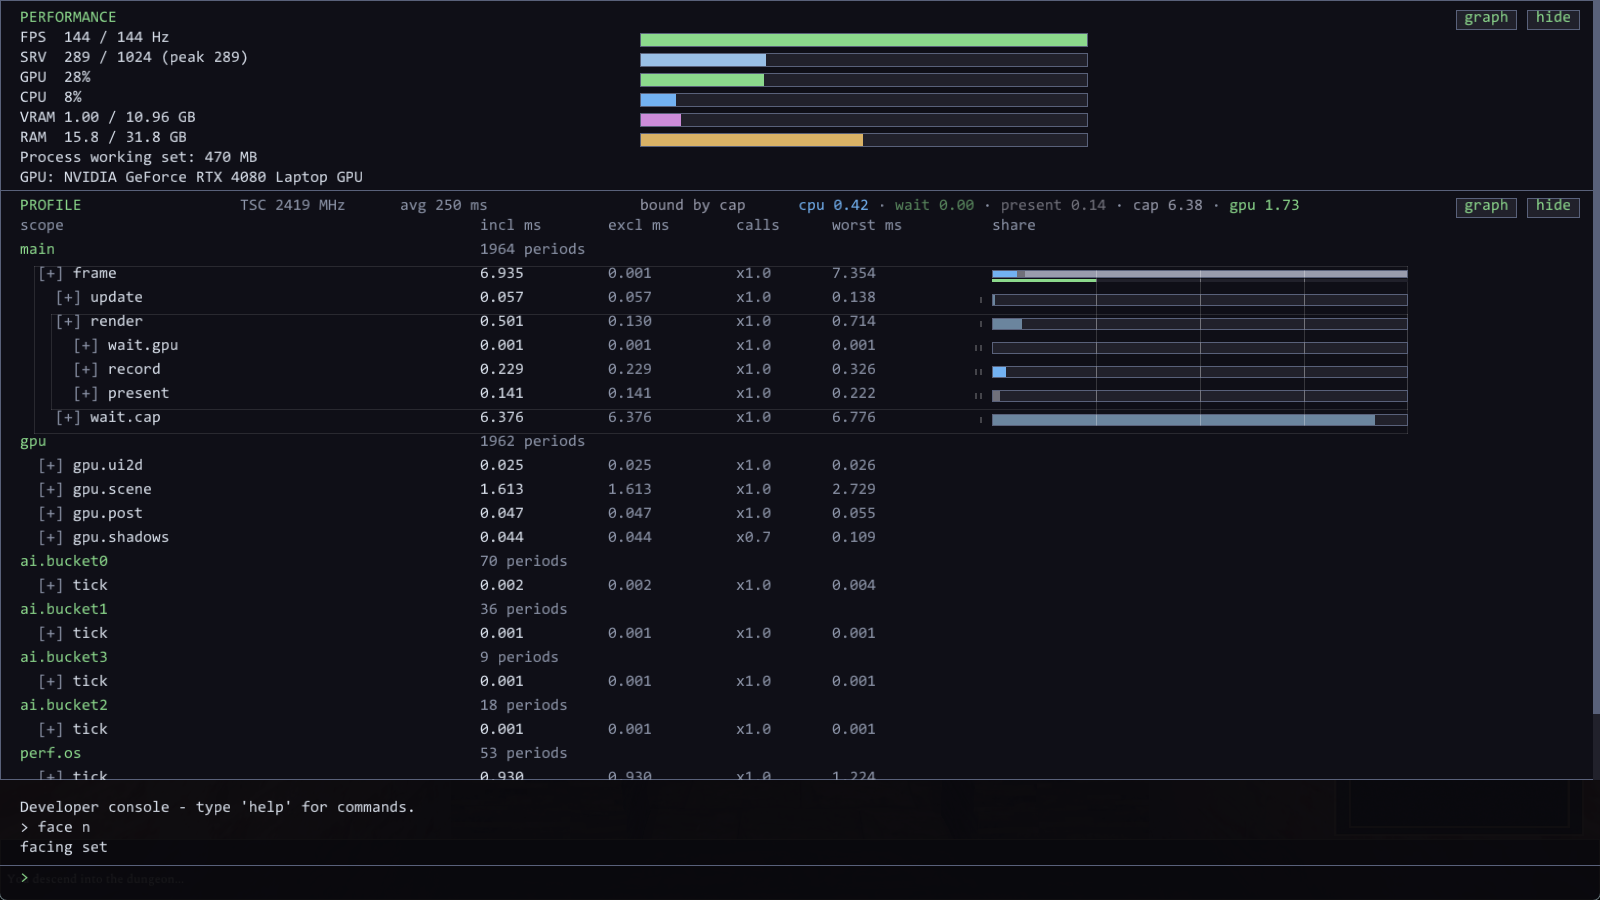
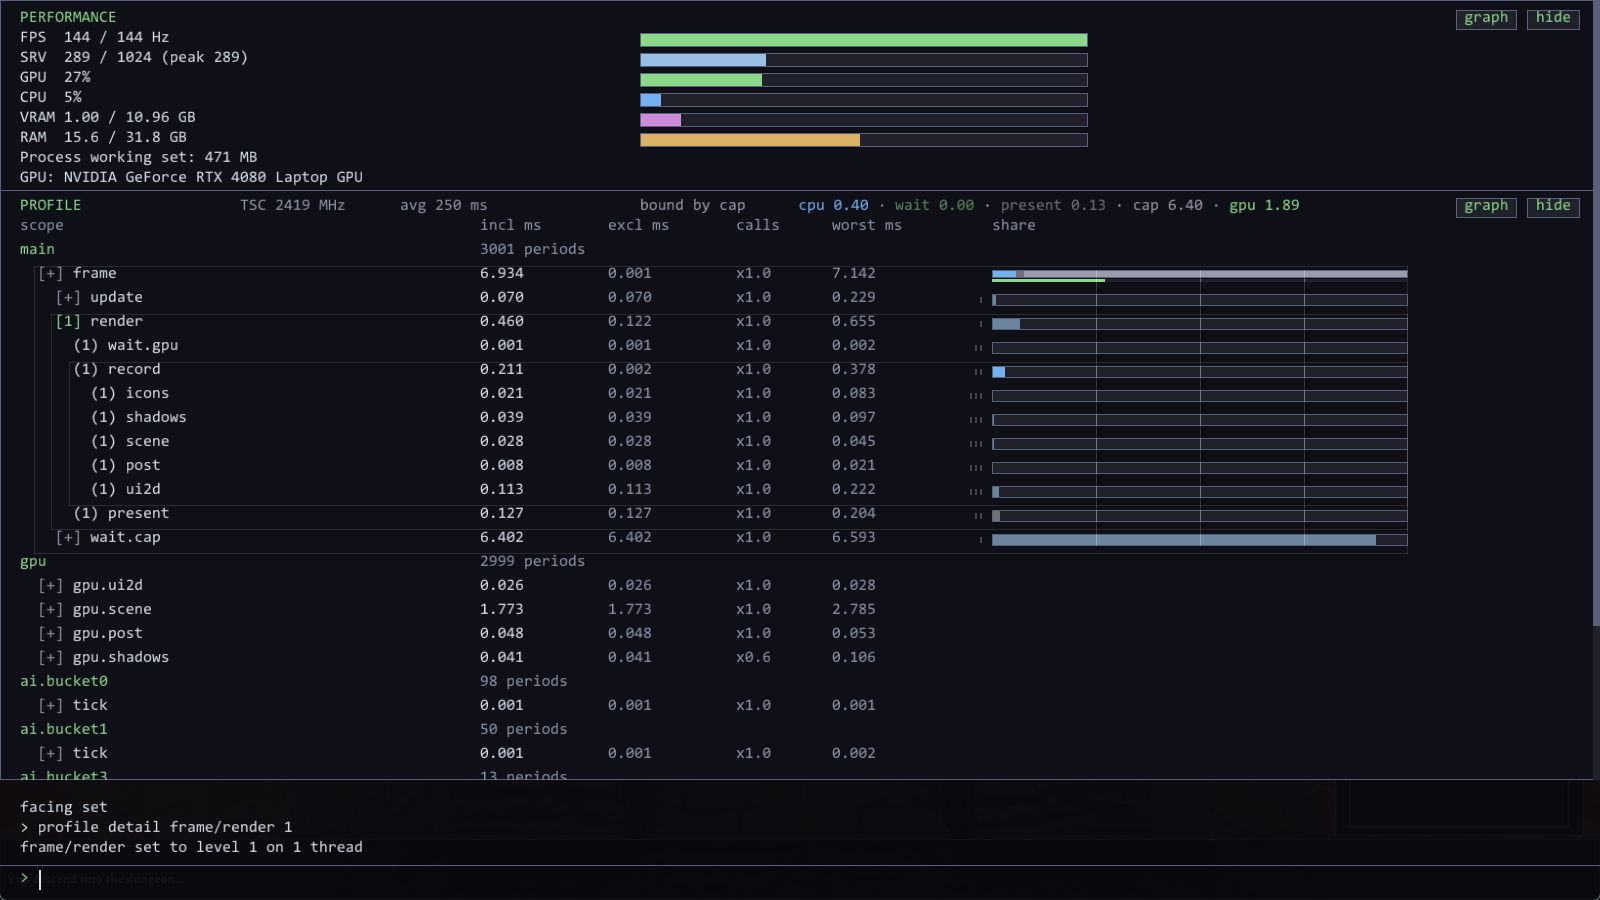
There is a limitation that falls out of this rather than being designed in: you can only raise detail on a branch that already exists, because you name a node by its path. Level-0 landmarks always record, so the top of every tree is there to aim at and you drill down from what you can see — raise a branch, look again, raise the branch that just appeared.
Storage belongs to the registry, not the thread
Each thread writes only to its own collector, so the hot path takes no lock and contends with nothing. But the collector does not live in the thread. The registry owns a fixed array of slots and a thread holds a pointer to one.
That inversion is about one specific API. This engine's thread manager can force-terminate a wedged worker with TerminateThread, which runs no destructors — not thread_local ones, not anything, and it may release the thread's TLS underneath whoever is holding it. A collector held as a genuine thread_local would leak or vanish at exactly the moment its profile is most wanted. Registry-owned, a killed worker's last tree is still sitting in its slot, readable.
Registration lives in the thread manager's worker loop rather than in any client, which is the difference between "the AI workers are profiled" and "threads are profiled". When I later moved a stray OS query onto a new background worker, it appeared in the profiler without anyone wiring it up.
And a frame is the main thread's unit; a tick is a worker's. The AI buckets run at 251/499/997/1999 ms, so forcing them into frame buckets would show empty trees and one false spike. Each collector publishes on its own boundary.
Two sinks, because an average cannot see a hitch
The tree aggregates. One node per call path, accumulating inclusive time and the time its children took, so exclusive time falls out by subtraction. It can tell you the average frame spends 4.1 ms in render. It can never tell you that one frame spent forty.
So there is a second sink: a per-thread ring of raw enter/exit events that wraps rather than growing, always recording, dumped on demand as Chrome Trace JSON that Perfetto and speedscope both read.
Always recording matters. A flight recorder is not a press-record button — by the time you notice a stutter it has already happened.
An event is 16 bytes and carries no kind field: a null zone means "exit of the innermost open scope", which the reader is already keeping a stack to know. That buys the packing for free and needs no interning, because zones are function-scope statics whose address is their identity.
On its first trace the ring justified itself: update had a mean of 0.025 ms and a max of 55.6 ms. A 2200x outlier that the tree had been averaging into nothing the entire time.
The GPU is one more thread
The CPU tree kept saying the same thing: about 0.2 ms of CPU work in a 4.1 ms frame, and scene costing eight microseconds. Eight microseconds, because that is only command recording — the GPU does the work afterwards, on its own clock, and nothing CPU-side can see it.
D3D12 timestamp queries fix that: a timestamp either side of each marked pass, resolved into a readback buffer at end of frame, read kFrameCount frames later in BeginFrame — right after the fence wait for the slot being reused, which is the exact point the GPU is known to have finished writing them. A GPU timing is therefore always a few frames stale. That is inherent; you cannot read a number the GPU has not written yet.
The part I am pleased with is where the results go. The profiler gained an external slot — a registry slot owned by no thread — and an AddSpan that takes a duration measured on another clock. GPU ticks convert to TSC units once via the frequency ratio, so one conversion function still means one thing everywhere.
The GPU is then simply a row called gpu in the tree. The console's list view, the graph view with its twelve seconds of history, and the trace dump all already knew how to draw a thread. None of them needed a line changed.
Measuring work is not the same as measuring the frame
The tree could now tell me what everything cost, and it still could not tell me what I actually wanted to know: what is holding the frame rate down. Those are different questions, and the second one is not answered by any amount of detail on the first.
Here is why. The render zone wrapped three things:
DN_PROFILE_ZONE("render");
list = device.BeginFrame(clearColor);   // fence wait: blocked on the GPU
game.Render(list);                      // command recording: actual work
device.EndFrame();                      // Present: blocked on the display
Two of those three are the main thread stopped, and the CPU-versus-GPU question lives entirely in which one it is stopped in. Undivided, all three arrive as one number that reads as "rendering is expensive" — so a frame parked at the display and a frame drowning in draw calls produce the same 4.1 ms and look identical.
The profiler had been measuring work and never waiting.
Splitting them is three zones, and each is a signature. Time in the fence wait means the GPU is running frames behind — GPU-bound. Time in command recording means the main thread is the ceiling — CPU-bound. Time in Present means being ahead of the display, which is the healthy answer.
The trap is that one of those three signatures is ambiguous. A blocking Present means either waiting for the vblank it is synced to or waiting for a back buffer the GPU has not released. Nothing in the call distinguishes them, so "which wait was longest" cannot tell display-bound from GPU-bound — the two most different diagnoses on the list.
What disambiguates them was already being collected: GPU busy time. If the GPU is saturated it is the ceiling regardless of which wait blocked; if it is mostly idle and the frame is at refresh cadence, it is the display. So the verdict tests GPU saturation first and lets the waits break only the remaining tie. That ordering is the whole reason the answer is trustworthy rather than merely plausible.
CPU time is then taken by elimination — the frame minus every block — rather than by reading the recording zone, which would miss update and the parts of render no zone covers and quietly flatter the CPU.
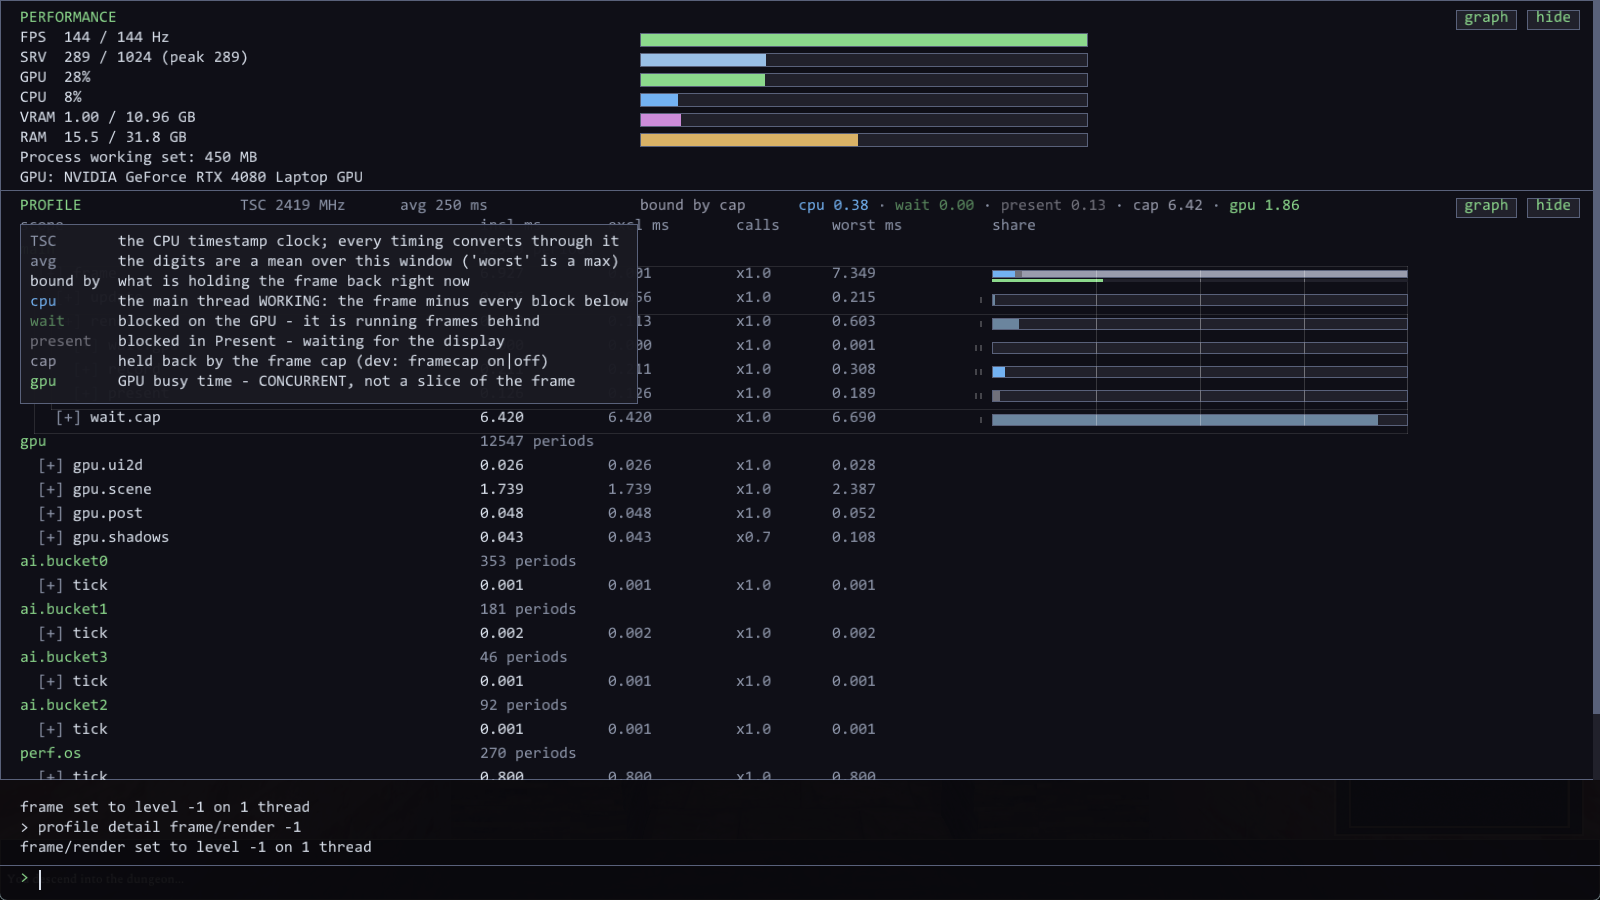
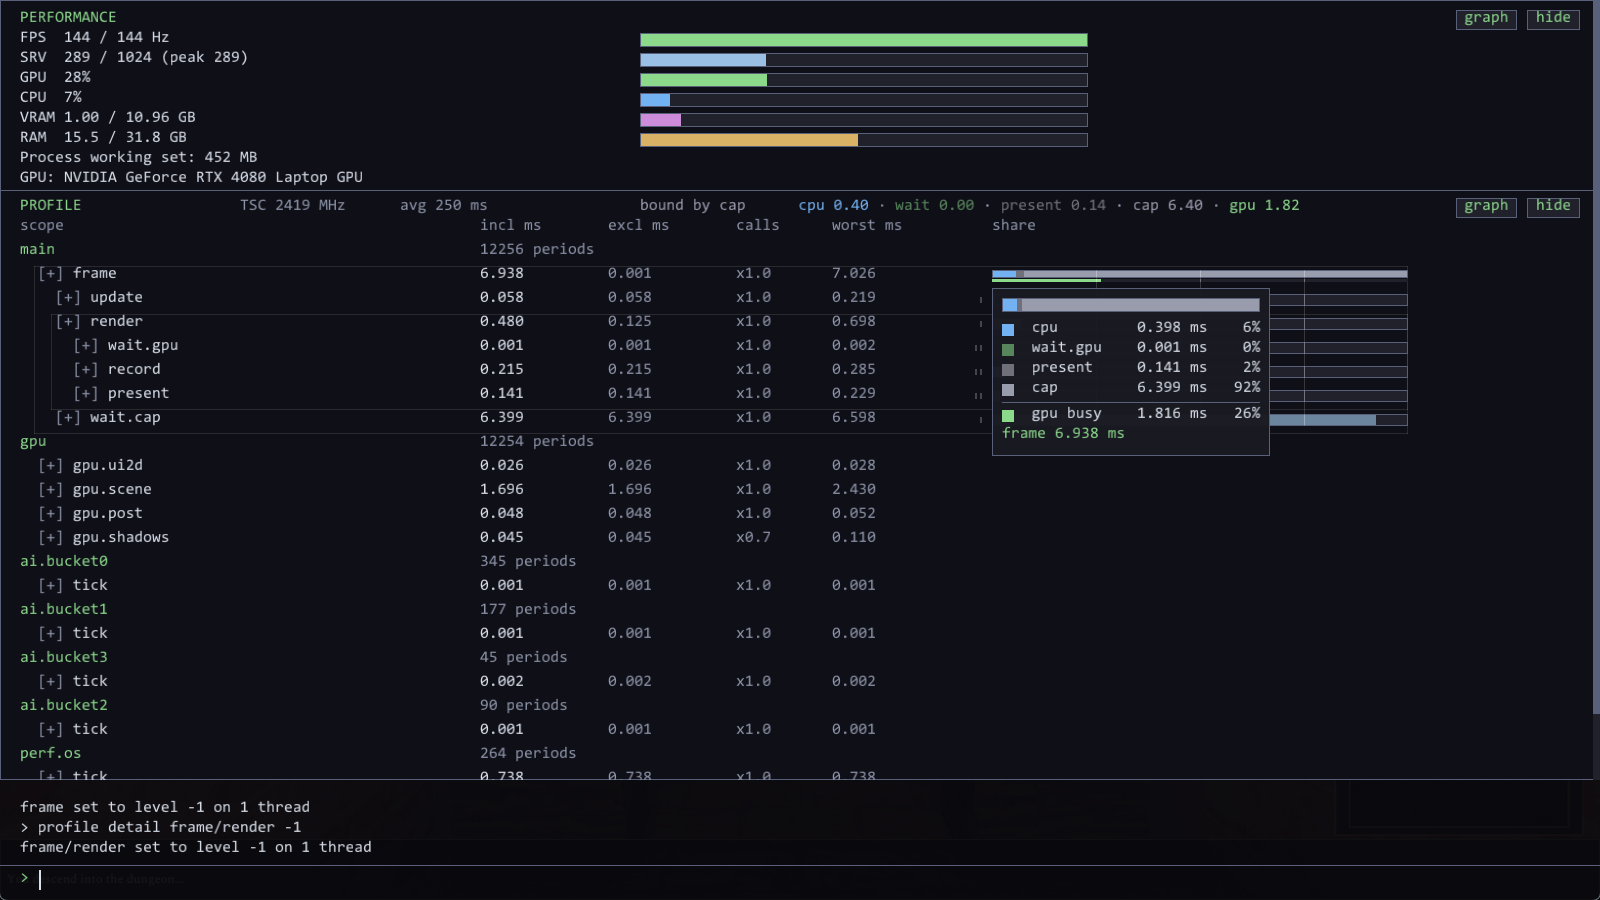
The panel now says bound by CPU, bound by GPU, bound by display or bound by cap on its header, with the four numbers it reasoned from beside it.
Reading it
The console panel has two views, and getting them readable took longer than getting them right.
The digits could not be read at all. Every figure on the panel was one published period, so at 240 fps they changed 240 times a second. Averaging alone does not fix that — a mean recomputed every frame is smoother but still repaints its low digits every frame, and the eye needs the number to hold still more than it needs it to be exact. So the window tumbles: samples accumulate for 250 ms, then the mean is committed and displayed unchanged until the next one. One mechanism buys both halves.
worst is the exception and takes the maximum over the window rather than the mean, for the same reason the graph history does. Averaging a worst case produces a number that is neither.
The bars became a chart rather than seven unrelated gauges. They used to be indented to match their row, which meant every depth measured from a different origin and no two bars could be compared; giving them one origin lets a single set of gridlines run the whole column and mean the same thing on every row. Nesting moved to pips in the gutter — outside the measured area, where nothing can be mistaken for a quantity — and a light frame around each parent and its children carries the grouping across the numbers, which the indentation only ever did at the far left.
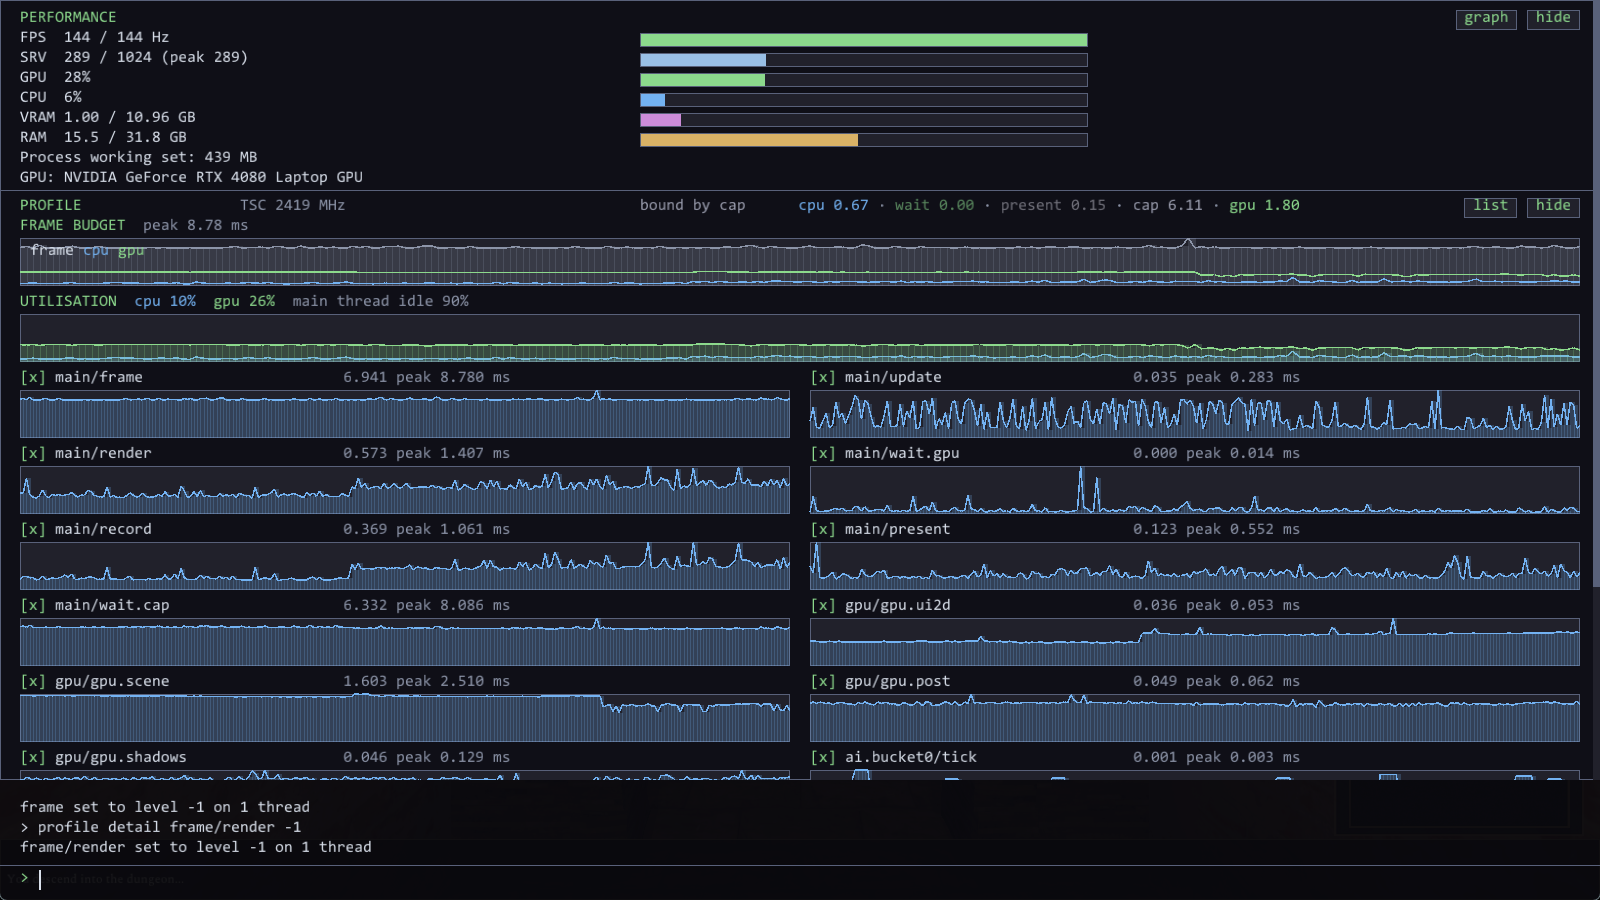
The graph view answers the other question. Every measure gets a line scrolling leftward, twelve seconds wide, sampled on a timer rather than per frame — at 240 fps a per-frame ring of 240 slots would hold one second, which is far too short to watch anything travel across it. Each slot keeps the maximum since the last commit, because a mean averages away the one frame that spiked and that frame is the entire reason to be looking.
Which sets up a distinction I had to be told about, by switching to this view and finding the numbers unreadable again: a plot and the number beside it want opposite things from the same measurement. The plot is a shape and needs the raw samples — smoothing it would iron out the very spike it exists to show. The label is read, and at frame rate it cannot be. So the graphs draw raw and their figures draw held, and the avg 250 ms note in the header had to stop being a list-view label, or a whole view would have been quietly reporting means as instants.
Two graphs lead it now. The budget in milliseconds, three series on one shared scale so that which of them tracks the frame is which one is the ceiling — the per-node graphs each autoscale to themselves, which makes them all look equally full and useless for that comparison. And utilisation on a fixed 0–100%, where the empty space above the lines is the headroom. No millisecond graph can show headroom, because it has no idea what "full" would be.
And a panel that only shows now cannot answer the question anyone has, which is "did that change help". profile snap <name> records over a few seconds; profile diff a b prints the budget deltas and then the rows that moved, biggest first. Keyed by thread and path, never by index — between two snapshots the tree has usually changed shape, and a positional key would diff one scope against another and report confident nonsense.
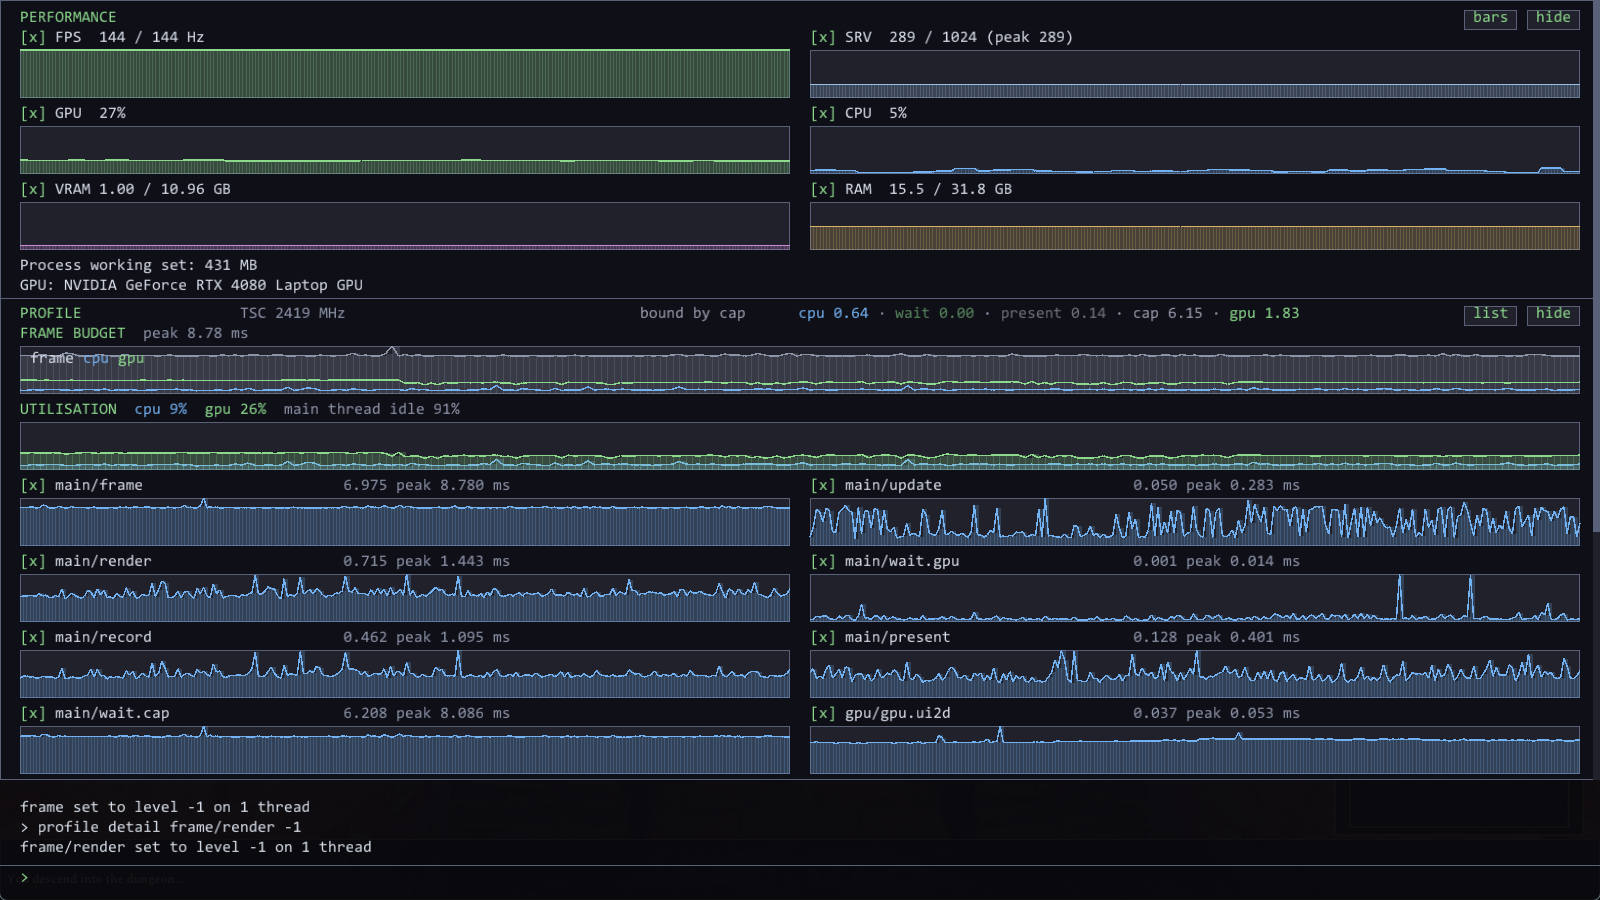
The six machine gauges — frame rate, CPU, GPU, RAM, VRAM, descriptor slots — get the same treatment with one difference: they graph against a fixed scale, because each has a natural ceiling. A profile timing has none, so it autoscales to its own window. Autoscaling a percentage would redraw 4% CPU as a full graph and make an idle machine look pegged.
Two details that only came from looking at it. The bars were originally drawn as each row's share of its thread's total — which meant every worker's single root node got a full-width bar beside a 0.000 ms reading, and the panel confidently showed four idle threads as saturated. And on a fixed scale, VRAM at 1 GB of an 11 GB budget is a 1.5px line four pixels off the floor, visually identical to an empty graph, until the area under it is filled.
The first thing it found
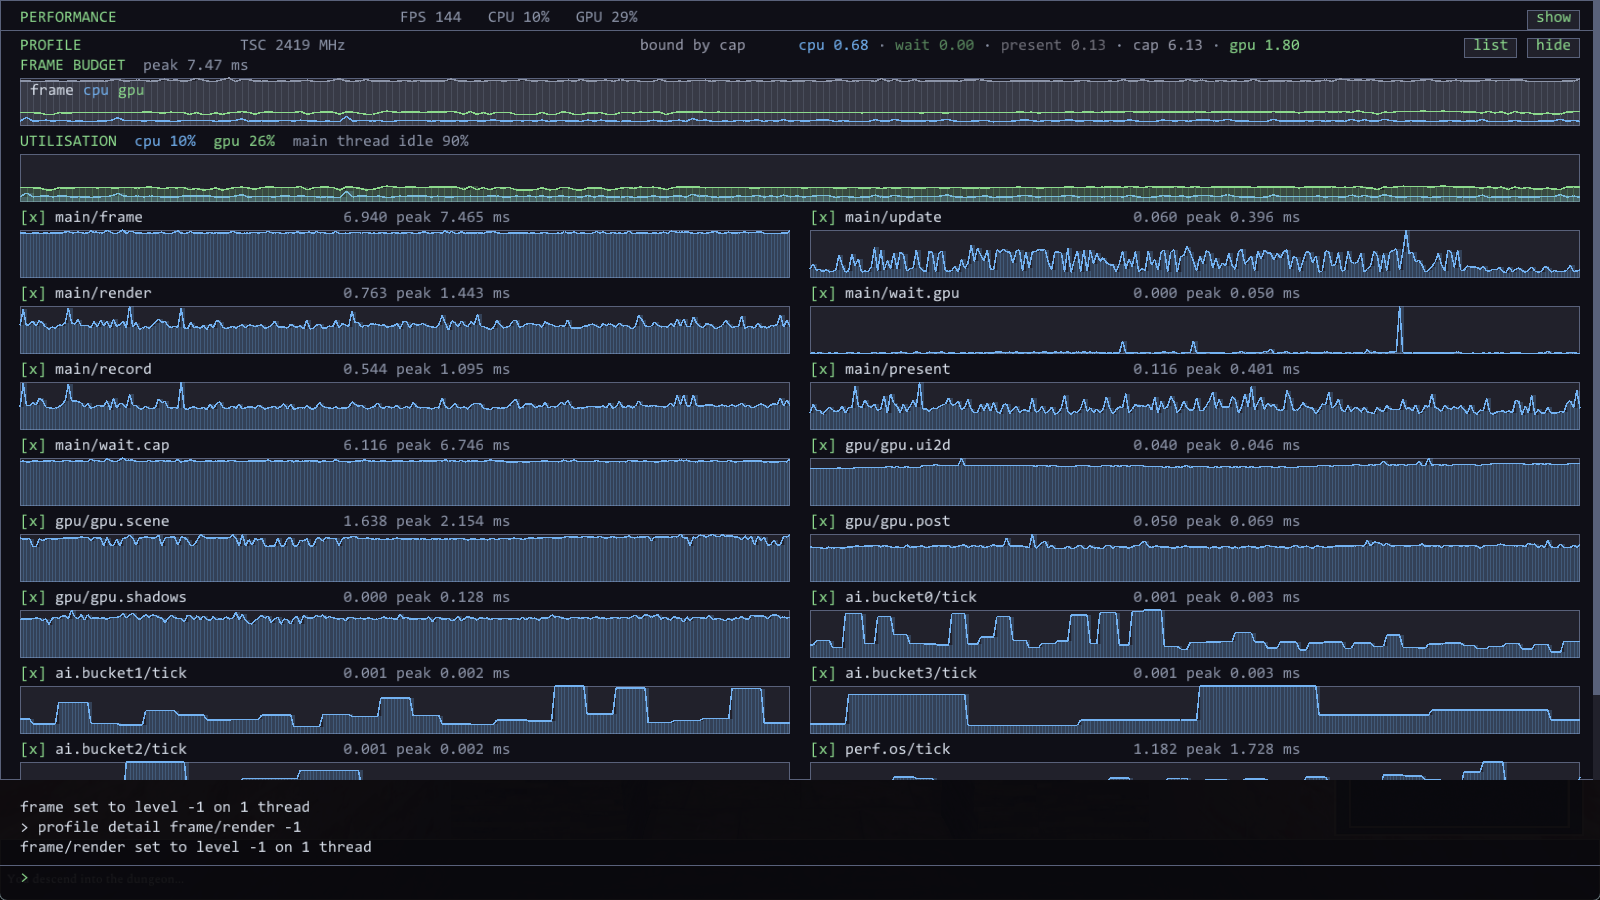
main/update had a mean of 0.03 ms and a peak over 1 ms, and in the graph view the peaks were suspiciously regular. A rhythm, not noise. An average would never have shown it; a max alone would have shown it without saying it repeated.
Level-2 zones through the console's own sampling named it in one trace: PerfMonitor's PDH GPU-engine query. Forty-one calls, every one over 50 µs, mean 578 µs — and the gap between them was 333 ms with a standard deviation of zero. A metronome, which is exactly what a 0.33 s sample interval makes it.
The size was not what made it worth fixing. PerfMonitor::Tick ran before the console's own is-open check, so that query was paid three times a second in every build whether the console was open or not. A diagnostic was taxing shipping frames. It moved, with the CPU and memory queries beside it, onto a managed worker:
| main thread | before | GPU query moved | all OS queries moved |
|---|---|---|---|
perfmon p99 |
591 µs | 26 µs | 0.6 µs |
update p99 |
627 µs | 146 µs | 124 µs |
world p99 |
72 µs | 86 µs | 97 µs |
world is the control, unchanged across all three, which is what says the comparison measures the change rather than the weather. And the signature disappeared rather than shrinking: main-thread calls over 50 µs went 41 (every 333 ms, stdev 0) → 22 (irregular) → zero of 3,277.
Then the shadows
With the GPU finally visible, the largest single thing the machine did was not the scene. It was shadows: gpu.shadows at 1.236 ms against gpu.scene at 0.876 ms.
The shadow pass already had a cache — a cube re-renders only if its light moved, the geometry changed, an animating caster is near, or a flicker tick is due. So the question was not "what does a cube cost" but "how much of the cache is missing".
That is a call count, not a timing, and the profiler reports call counts. Two level-2 zones — one per cube re-rendered, one per face — and the answer over 1,009 frames was 3.50 cubes and 20.98 faces per frame out of eight slots. At 240 fps, about five thousand shadow-face renders a second.
The cause was one line:
constexpr u64 kFlickerInterval = 2; // re-render wandering fire cubes at half rate
const bool flickerDue = (m_frameCounter + slot) % kFlickerInterval == 0;
"Half rate" is not a rate. Seven fire lights held shadow slots, each re-rendering every other frame on a stagger: 3.5 cubes a frame by construction, and the measurement agreed to two decimal places.
Two things follow, and the second is the real bug. The cost per second scaled with frame rate for no visual gain — and the flicker itself ran four times faster at 240 fps than at 60. The fire looked different on different hardware.
The fix is that a flicker interval is measured in hertz. A fire cube now re-renders at most every 1/hz seconds, with a per-frame budget that also staggers them so they cannot all come due on one frame:
| cubes/frame | faces/frame | CPU shadows mean / p99 | |
|---|---|---|---|
| frame-counted | 3.50 | 20.98 | 95.7 µs / 200.4 µs |
| time-based, 14 Hz | 0.39 | 2.33 | 14.5 µs / 94.0 µs |
Nine times fewer shadow faces, and the GPU gauge fell from 44–47% to 30% across the change — a corroboration from a number the profiler does not produce.
Only a flicker render re-paces the flicker clock. A cube re-rendered because a monster walked past does not reset the aesthetic cadence, or a busy room would flicker faster than a quiet one.
And then the frames nobody ever saw
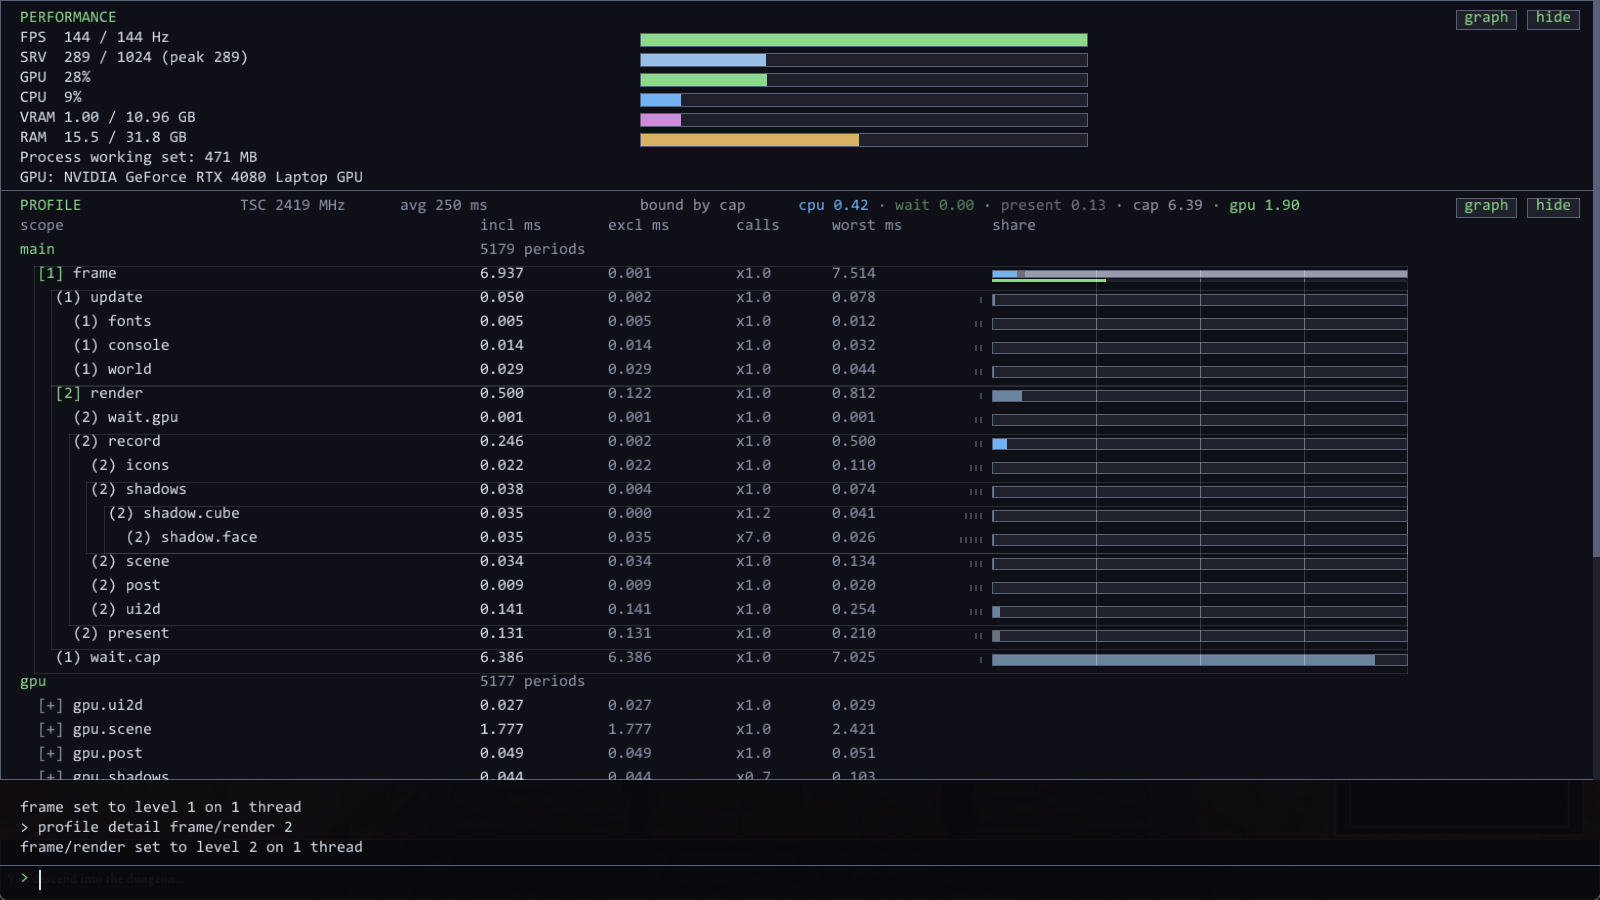
With the waits separated, the panel said something I had been looking straight past for weeks: of a 4.163 ms frame, 3.85 ms was present and the fence wait was a flat 0.000. The CPU did 0.31 ms of work, the GPU 1.79 ms, and the rest of the frame was the main thread standing still.
Display-bound, then, and healthy. Except the numbers did not agree with the machine. A 4.163 ms frame is 240 fps. The window was on a 144 Hz monitor, where vblank is every 6.94 ms.
So Present was blocking — genuinely, measurably, for 3.85 ms — and syncing to something at 240 Hz that was not the display it was drawn on.
A sync interval of 1 does not mean "the refresh rate of this monitor". A windowed flip-model swapchain is paced by DWM, and on a mixed-refresh desktop DWM composes at the fastest attached display's rate. There are three 240 Hz panels elsewhere on this desk. The game was being paced by monitors it was not on.
I did not want to build a fix on an inference, so the inference got a test with a prediction attached. Halving the present interval should divide whichever clock is really pacing: 8.33 ms if it is 240 Hz, 13.9 ms if it is 144. Measured: 8.336 ms. Then moving the window bodily onto a 240 Hz monitor changed the frame time by 0.001 ms — the pacing clock never depended on the window's monitor at all.
Two of every five frames were being rendered and thrown away.
Present cannot be asked to fix this, since its interval divides DWM's clock rather than the output's, so the cap is a wait of our own on top: a deadline that accumulates a slice per frame — restarting from "now" each time folds every overshoot into the next slice and drifts permanently slow — a high-resolution waitable timer for the bulk, a spin for the last half-millisecond, and a resync when the deadline goes more than four slices stale, since after a load screen honouring it would run a burst of uncapped frames trying to make the time back.
| uncapped | capped | |
|---|---|---|
| frame | 4.163 ms (240 fps) | 6.936 ms (144.2 fps) |
present |
3.852 | 0.137 |
wait.cap |
0.000 | 6.403 |
| GPU per frame | 1.786 | 1.771 |
Per-frame GPU work is unchanged, so the entire 40% is saved: 1.79 ms × 240 becomes 1.77 ms × 144, for the same thing on screen. The GPU gauge fell from 41% to 28%.
The cap's own wait is instrumented, and that was not optional. wait.cap is a sibling of render with its own zone, and the budget subtracts it like the other two blocks. Without that, capping the frame rate would have made the panel report the engine as CPU-bound — the exact opposite of what a frame spent deliberately idle means. It gets its own verdict for the same reason: display-bound and cap-bound are both "not the hardware", but one is finished and the other is a limit you set and can raise.
A side effect I only noticed afterwards: the Video tab's Frame Rate labels were already computed as refresh / interval and had been describing a cap that nothing enforced. They are true now.
What it cost
A profiler that lies is worse than none, and mine lied twice before I looked at it. The share bar showed idle worker threads as saturated. The GPU rows were absent from the trace dump because AddSpan accumulates into the tree without writing ring events — the console shows them, a Perfetto dump does not. That second one is still true.
I instrumented the wrong side of a call. The world update is reached from two places in Game::Update: the normal playing path, and the one taken while the dev console owns input. I put the zone on the playing call site, which meant that with the console open — which is to say, whenever anyone is looking — the world's cost silently vanished from the tree. update showed 0.027 ms of unexplained exclusive time and no world row at all. Moving the zone into the callee fixed it and the accounting closed exactly. The rule: instrument where the work is, not where a caller invokes it, whenever more than one path can reach it.
The panel outgrew its own screen. With both sections graphed it drew over the command line — over the one control that would have let me narrow it back down. It now bounds itself and scrolls, and says what it dropped, because a panel showing eight of twelve measures looks exactly like a panel showing all twelve.
if constexpr does not discard in a non-template. Twenty unreachable-code warnings from a body the disabled build was never going to run. The preprocessor split does what I meant.
The verdict had only ever said one thing. Across an entire session of use it read bound by display in every screenshot — which is consistent with a correct instrument on an idle engine, and equally consistent with a constant. I nearly shipped it on that. It took deliberately loading the machine two different ways before I had any evidence it could say anything else, and I do not think an instrument that has produced one reading has been tested at all.
Two colours meant two things. The budget painted CPU work in the same amber the gauges use for RAM, and present in the same blue they use for CPU — so the largest block on the bar looked like CPU time, which is the precise misreading the bar exists to prevent. The two processors now have one colour each, defined once and used by both sections. Fixing that exposed a second contradiction: the ordinary share bar was also that CPU blue, so the present row drew a blue bar underneath a grey present segment, saying the CPU worked for 3.8 ms and did nothing for 3.8 ms at once.
Two things I built could not be read. The first real profile diff produced a correct twenty-line comparison into a scrollback that shows three lines above the prompt, so the answer scrolled past as it was printed. And four snapshot slots ran out mid-investigation, after which snap refused and the diff that followed reported an unknown name. Both are the same failure — an answer that exists and cannot be reached — and both were found by using the feature rather than by testing it.
I set a colour by taste and it was invisible. The group frames went in at an alpha that only showed up under 2× magnification, which makes them decoration rather than a cue. Looking at it at 1:1 is what fixed it, and there is no substitute for that step.
What it bought
Three real fixes, none in a place I would have guessed: a diagnostic taxing every shipped frame three times a second, a shadow cadence tied to frame rate, and two of every five frames rendered for a monitor that was never going to show them.
The last one is the one I would not have found by reasoning. Every individual number was innocent — the frame was fast, Present was blocking exactly as a synced present should, the GPU was idle. It only became visible when the frame's wall clock was broken into work and blocks and the arithmetic stopped matching the refresh rate of the screen it was on.
More usefully, the questions changed. "Is render slow?" became "render is 4.07 ms of which 3.94 is exclusive, so 95% of the frame is present wait and the CPU is idle" — and then stopped being a question at all, because the panel now says bound by display and shows its working.
And the headroom stopped being a guess. Ultra quality costs +1.7 ms of GPU and moves the frame time by 0.1%, because the idle absorbs all of it. That is a measurement, not an argument, and it is the difference between "we could probably afford better shadows" and "turn it on".
How it's proved
The clock decision came from a benchmark, not an argument, and two of its six numbers turned out to be measurement artefacts — the optimiser had hoisted a loop-invariant scan, and a constant-folded comparison — which I could only tell because the results were implausible. They are reported as unmeasurable rather than as zero.
The trace format is checked by parsing it back: 30,077 events, zero out-of-order timestamps, zero unmatched ends, zero unclosed scopes, nesting depth 2 on main and 1 per worker. A trace that merely looks written is worthless if a viewer chokes on it.
Every performance claim above is a before/after from two traces of the same length analysed by the same script, with world as an unchanged control. The disabled build is verified by absence: no profiling strings in the binary, and 31 KB smaller.
The pacing bug was diagnosed by prediction, not observation: halving the present interval had to divide one of two clocks, and the two candidates gave 8.33 ms and 13.9 ms. Getting 8.336 is a different kind of evidence from noticing that 4.163 looks wrong.
And the panel now has a check in the regression suite that does what a person does with it — snapshot, change, snapshot. It asserts the budget still sums to the frame, which is the failure mode that matters: add a blocking call without a zone and the unaccounted time lands in cpu by elimination, so an idle engine reads as CPU-bound with nothing crashing to say so. It forces two different changes, because a half-dead readout can pass one by accident. Current numbers: drift 0.0000 ms on every snapshot, ultra +94% GPU, cap 0.1% off a 144 Hz target — with the target parsed from the game's own report rather than hardcoded, so the check is not pinned to my monitor.
Its self-test inverts only the coverage assertion. The partition and reaction checks have each failed for real during development, which is weaker evidence than a harness that can produce the failure on demand, and the run prints that limitation every time rather than leaving it to be assumed.
Still open
GPU spans are not in the trace. They reach the console but not a Perfetto dump. Worse, putting them on the same timeline as CPU spans needs GetClockCalibration to pair the two clocks — durations would be right, absolute placement would not.
The 25 Hz default is not measured. 14 Hz is the figure in the table; 25 Hz is where the fire stopped looking slowed down when I compared 8 / 14 / 25 / 40 with the live knob. The cost at 25 Hz should be roughly 4 faces a frame rather than 2.33, still a five-fold improvement over frame-counted — but that is arithmetic, not a measurement, and it is labelled as such.
GPU spans are flat. Passes are siblings anyway, so flat keeps the root placement honest rather than double-counting a parent, but a nested GPU pass would currently be dropped rather than mis-parented.
os.cpu costs more on the worker than it did on the frame — 297 µs against 78 µs — because a background thread is descheduled more readily. That is not a regression; it is precisely why it belongs there. But it is a reminder that moving work off the frame changes what the work costs, and a number measured in one place does not transfer to another.
Clearing a detail override does not remove the rows it revealed — they stay listed at zero calls, because a node is never dropped from a published tree and that is what keeps node indices stable for the graph series. The tree therefore shows what is being measured, not what once was, and a collapsed branch has to be filtered out at display time rather than actually going away.
ui2d is 65% of all CPU command recording — more than the entire 3D path combined. At 0.3 ms of CPU in a 6.9 ms frame that is irrelevant, and it is the first place I will look if the CPU ever becomes the bound. I have not looked yet.
The GPU scene cost swings 30% on a static view — 1.21 ms to 0.87 ms with nothing moving and nobody touching the controls. Either something real is varying (fire flicker moves light positions, which moves the dust raymarch and the shadow-cube cache) or the GPU timing is noisier than it looks. I would want to know which before trusting gpu.scene to a fine margin, and I do not.
The frame cap is on by default, which is a behaviour change I made on my own judgement. It is right for this machine and this desk arrangement. On a single-monitor setup it does nothing at all, which is fine — but "does nothing" and "is correct" are not the same claim, and I have only tested the first.
The console is the largest screen in the game that the UI overlap audit does not cover, because it predates the control-tree work and draws immediate-mode. Every hand-written y += in it is a future bug. I chose to keep paying that rather than convert it mid-investigation; the trigger to revisit is the next panel it grows.